Buying a 3d Profilometer Inspection system is rarely a simple equipment comparison. Engineers must connect surface measurements with yield, traceability, and production speed. A shiny wafer may look perfect, yet hidden roughness can affect coating adhesion, friction, or electrical performance. Small errors matter.
SEMI’s 2024 World Fab Forecast projected global semiconductor manufacturing capacity growth of approximately 6.4% in 2024. This expansion increases demand for reliable, repeatable surface metrology across wafers, coatings, precision parts, and advanced packaging. Meanwhile, ISO 25178 defines key areal surface-texture parameters, including Sa, Sq, and Sz. These standards help buyers compare specifications, but they do not guarantee practical performance on every material. Measurement setup matters.
This guide addresses the Top 10 3D Profilometer Inspection Questions Buyers Ask. It examines vertical resolution, lateral resolution, scanning speed, field of view, software capability, calibration, and integration. It also considers transparent films, steep edges, reflective surfaces, and vibration-sensitive factory floors. These details often decide whether a system performs well outside a showroom.
NIST metrology guidance emphasizes traceability, uncertainty evaluation, and suitable calibration methods. Buyers should therefore request repeatability data, sample test results, and measurement uncertainty statements. Vendor claims deserve verification. Even experienced teams can overlook lighting, fixturing, or analysis settings.
A useful purchasing decision combines published specifications with real samples, production targets, and operator feedback. The best system is not always the one with the smallest advertised nanometer value. It is the one that produces trustworthy data, consistently, under actual working conditions.
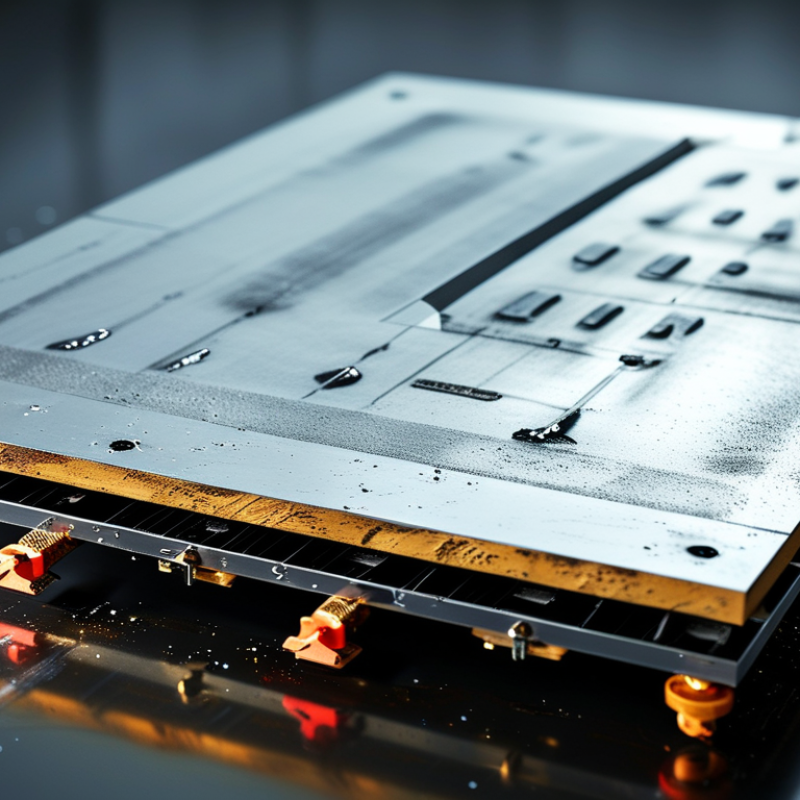
A 3D profilometer measures a surface’s three-dimensional shape. It records height across X and Y positions, creating a detailed topographic map. Unlike a single line profile, it shows texture over an area. This helps inspectors locate scratches, pits, dents, edges, and uneven regions.
Common results include surface roughness, waviness, step height, peak height, valley depth, and material volume. Parameters such as Ra and Rz describe line roughness. Sa and Sz describe areal surface conditions.
The instrument can also compare a measured surface with a design reference. Small changes may reveal poor polishing, coating variation, or machining marks.
The method matters. Optical systems scan without touching the part, while stylus systems physically trace the surface. Highly reflective, transparent, steep, or very dark areas can produce uncertain data. A colorful 3D image can still mislead. Calibration, filtering, lighting, scan size, and measurement direction affect the result. I would not approve a part from one attractive image alone. Repeating the scan and checking the raw profile is safer. Operators should record the objective, sampling area, and settings. This detail supports traceability and makes later comparisons more reliable. Some surfaces remain difficult, even with careful setup.

Top 10 3D Profilometer Inspection Questions Buyers Ask?
Which Inspection Technology Best Fits the Application?
Choosing a 3D profilometer starts with the surface, not the brochure. Laser triangulation suits fast line scans on machined parts and moving production lines. Structured light captures wider areas quickly, making it useful for castings, molded components, and assembly checks. However, dark, shiny, or transparent surfaces can reduce measurement stability. Real samples must be tested.
Confocal and focus-variation systems often provide stronger results on steep edges, fine steps, or difficult reflective materials. They can measure a small 10-micrometer feature, but scanning may take longer. Resolution is not the same as accuracy. Buyers should compare repeatability, uncertainty, field of view, and working distance under actual factory conditions. A clean laboratory sample can hide serious production problems.
Ask how the system handles vibration, dust, changing light, and part-to-part variation. Check whether the software reports missing points clearly instead of quietly filling them. That detail matters. Inspectors should also review calibration routines, data export, operator training, and maintenance needs. In practice, the “best” technology may be a compromise between speed and surface coverage. I have seen technically impressive measurements fail because the fixture moved slightly. That lesson is easy to overlook. A pilot test with production parts remains more reliable than a specification sheet.
Which inspection technology best fits the application?
The chart compares representative minimum vertical resolution values for commonly used 3D inspection technologies. Lower values indicate finer height sensitivity. White-light interferometry and confocal methods are generally suited to fine surface texture and micro-step measurements, while focus variation, laser triangulation, and structured light are often better for rough, reflective, large, or geometrically complex parts. Actual performance depends on optics, surface finish, field of view, measurement range, and sampling conditions.
When buyers compare 3D profilometers, accuracy, resolution, and repeatability are often treated as interchangeable. They are not. Accuracy describes closeness to a known reference, while resolution describes the smallest surface change the system can display. Repeatability shows whether repeated scans produce nearly identical results under unchanged conditions. A sharp-looking image can still contain incorrect measurements. That distinction matters.
Ask how each specification was tested. Was the reference artifact traceable? What surface material, scan area, lighting, vibration, and temperature were used? A factory floor rarely behaves like a laboratory. In practical inspections, dust, reflective metal, steep edges, and part curvature can reduce confidence. Compare results at the measurement height and field of view you will actually use. Do not select the smallest quoted resolution automatically. It may increase noise or slow inspection.
For repeatability, request several scans of the same part, not one impressive sample. Review the spread of peak height, valley depth, step height, and roughness values. Accuracy should be checked across the full working range, not only near the center. I have seen buyers focus on nanometer-level resolution while ignoring fixture movement. That is an expensive mismatch. Still, published numbers need context. Ask for raw test conditions, uncertainty information, and an application trial. Your own surface may behave differently. Leave room for that uncertainty.
| No. | Buyer Question | Dimension to Compare | What the Term Means | Practical Comparison Method | Typical Reference Guidance |
|---|---|---|---|---|---|
| 1 | How should measurement accuracy be compared? | Accuracy / trueness | The closeness of a measured result to an accepted reference value. It is different from resolution and repeatability. | Request results from a calibrated step-height or certified artifact measured under the intended working distance, field of view, objective, and data-processing settings. | Compare the stated error in micrometres or as a percentage of the measured height. A smaller maximum error is better, provided the test conditions are equivalent. |
| 2 | Does higher resolution always mean better inspection? | Lateral and vertical resolution | Lateral resolution describes the smallest separable feature in the X–Y plane; vertical resolution describes the smallest distinguishable height change along the Z axis. | Match the resolution to the smallest defect or surface feature that must be detected. Check whether the value is optical resolution, sampling pitch, display resolution, or noise level. | For many industrial optical systems, lateral sampling may range from about 1 to 20 µm and vertical noise may range from sub-micrometre to several micrometres, depending strongly on optics, surface, and measurement mode. |
| 3 | How can repeatability be verified? | Repeatability | The variation when the same operator measures the same feature using the same instrument, method, location, and conditions over a short period. | Measure the same artifact at least 10 times without changing the setup. Review the standard deviation, range, and maximum deviation from the mean. | For a stable, high-contrast surface, a repeatability result below one measurement unit is often desirable; the acceptable value must be tied to the product tolerance and measurement uncertainty. |
| 4 | What is the difference between repeatability and reproducibility? | Gage R&R capability | Repeatability covers equipment variation. Reproducibility includes variation between operators, setups, days, or other measurement conditions. | Run a measurement-system analysis using multiple parts, operators, and repeated trials. Separate equipment variation from operator and part-to-part variation. | A commonly used screening rule is total Gage R&R below 10% of study variation or tolerance; 10%–30% may require application-specific approval, while values above 30% are generally considered unsuitable without improvement. |
| 5 | Which measuring range and field of view are required? | X–Y range, Z range, and field of view | The measurable area and height span determine whether a part can be inspected in one scan or requires stitching and multiple positions. | Compare the largest part dimension, maximum step height, surface slope, and required feature size with the range available at the selected magnification. | A larger field of view usually improves coverage and speed, while higher magnification generally improves feature detail but reduces coverage. These specifications must be evaluated together. |
| 6 | Can the system measure reflective, transparent, or dark surfaces? | Surface compatibility | Optical signal quality depends on reflectivity, transparency, roughness, color, slope, and the presence of glare or subsurface reflections. | Provide representative samples, including the most difficult finish. Check valid-point rate, edge performance, missing data, and measurement bias rather than accepting a demonstration on an easy surface. | No single optical method performs equally well on every surface. Adjustable illumination, multiple sensing modes, polarization, or surface preparation may be required. |
| 7 | How fast can a complete inspection be performed? | Cycle time and throughput | Cycle time includes part loading, alignment, acquisition, scanning, data processing, pass/fail evaluation, and result storage—not only camera exposure or scan time. | Use the full inspection recipe on representative parts. Record average cycle time, worst-case time, percentage of invalid scans, and time required for recalibration or cleaning. | Shorter acquisition time can increase noise or missing data. Compare throughput only at the same accuracy, coverage, and acceptance criteria. |
| 8 | How important are calibration and traceability? | Calibration, traceability, and uncertainty | Calibration establishes the relationship between instrument readings and reference standards. Traceability links the result through documented calibrations to recognized standards. | Ask for calibration procedures, artifact certificates, calibration intervals, environmental requirements, and an uncertainty budget for the intended measurement task. | The expanded measurement uncertainty should be sufficiently smaller than the product tolerance. A commonly applied decision guideline is a 4:1 tolerance-to-uncertainty ratio, although application standards may differ. |
| 9 | Which 3D surface parameters should be reported? | Profile and areal surface parameters | Common parameters include Ra and Rz for profiles, and Sa and Sz for areal surfaces. Results depend on filtering, evaluation area, cutoff, leveling, and outlier treatment. | Use the same measurement area, filtering rules, units, form-removal method, and parameter definitions across all systems being compared. | Ra and Sa are average roughness measures; Rz and Sz describe height ranges or peak-to-valley behavior. They are not interchangeable and should not be compared without identical settings. |
| 10 | What software, data, and integration features are needed? | Automation, reporting, and data interoperability | Inspection value depends on repeatable recipes, automatic alignment, region-of-interest analysis, tolerance evaluation, audit trails, and export of usable measurement data. | Verify support for standard file formats, statistical export, barcode or lot tracking, programmable recipes, user permissions, remote control, and communication with quality or manufacturing systems. | A suitable system should preserve raw or traceable processed data, record operator and recipe information, and allow results to be reproduced after software or recipe changes. |
The sample determines whether a 3D profilometer produces useful data. Ask about size, material, reflectivity, transparency, surface roughness, and edge geometry. A polished metal surface may need different optical settings than a textured polymer. Very steep walls can also hide critical features. Provide real production samples, not only ideal laboratory pieces. That choice often exposes problems early.
Workflow requirements matter just as much. Consider how operators load parts, position reference points, and repeat measurements. Inspection time should include fixturing, scanning, analysis, and reporting. A fast scan is not efficient if setup takes ten minutes. I have seen teams overlook vibration, dust, and temperature changes. These details can affect repeatability more than the advertised resolution. The workflow may need refinement after real trial runs.
Tips: Test several samples with known defects. Compare results against a trusted reference method. Confirm whether software supports automated recipes, batch analysis, measurement templates, and clear data export. Check user permissions, traceable records, calibration reminders, and integration with existing systems. Ask how failed scans are handled. A useful system should explain missing points instead of quietly producing attractive images. Mistakes still happen. Build review steps into the process.
When buyers compare 3D profilometers, the purchase price is only the visible part of the decision. A low-cost system may require expensive fixtures, software upgrades, or repeated operator training. Ask what the quoted price includes. Installation, calibration tools, measurement software, and application support can change the real budget.
Support often becomes important after the equipment arrives. Can engineers help create the first measurement recipe? How quickly can they respond when data looks inconsistent? Reliable suppliers should provide clear documentation, training records, and practical troubleshooting guidance. During evaluations, inspect sample parts similar to your production work. A polished demonstration is useful, but it cannot replace repeatable tests on rough, reflective, or tightly toleranced surfaces.
Long-term value depends on measurement stability, serviceability, and workflow fit. Check calibration intervals, spare-part availability, software maintenance fees, and compatibility with existing inspection systems. A system that saves ten minutes per batch may recover its cost faster than a cheaper unit that slows analysis. Still, cost models are imperfect. Operators may need more training than expected, and production conditions can change. Leave room for these uncertainties. Review results from several shifts, not one ideal afternoon. A trustworthy decision uses recorded data, realistic labor costs, and documented support commitments rather than impressive promises.