Leave Your Message
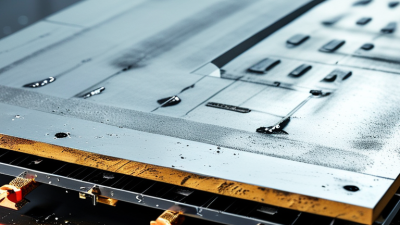
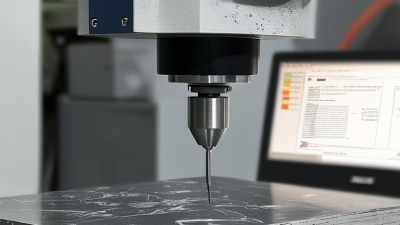
As manufacturers pursue tighter tolerances, surface measurement has become a practical quality-control tool. A tiny ridge on a machined seal or a coating defect on a phone component can affect fit, friction, and product life. 3D Profilometer Inspection helps teams capture surface height, roughness, and shape without relying only on visual checks.
The MarketsandMarkets report on the 3D metrology market estimated growth from USD 11.1 billion in 2023 to USD 18.3 billion by 2028, at a 10.5% compound annual growth rate. This figure covers a broader market, not profilometers alone, so it should be read as context rather than a direct measure of profilometer demand. ISO 25178, meanwhile, provides a recognized framework for areal surface-texture measurement. These references matter because supplier claims are easier to assess when buyers can connect performance specifications with established measurement practice.
This guide examines China’s top 10 3D profilometer inspection suppliers through practical criteria: measurement principle, vertical and lateral resolution, scan speed, software workflow, calibration support, and application experience. Optical, laser, and confocal systems may suit different surfaces; a reflective wafer and a rough metal part do not behave alike. Details matter.
A ranking can still miss something. Published specifications rarely reveal how smoothly a system handles a real production line, or how quickly support resolves a measurement issue. Buyers should verify sample results, service coverage, and data compatibility before choosing a supplier.
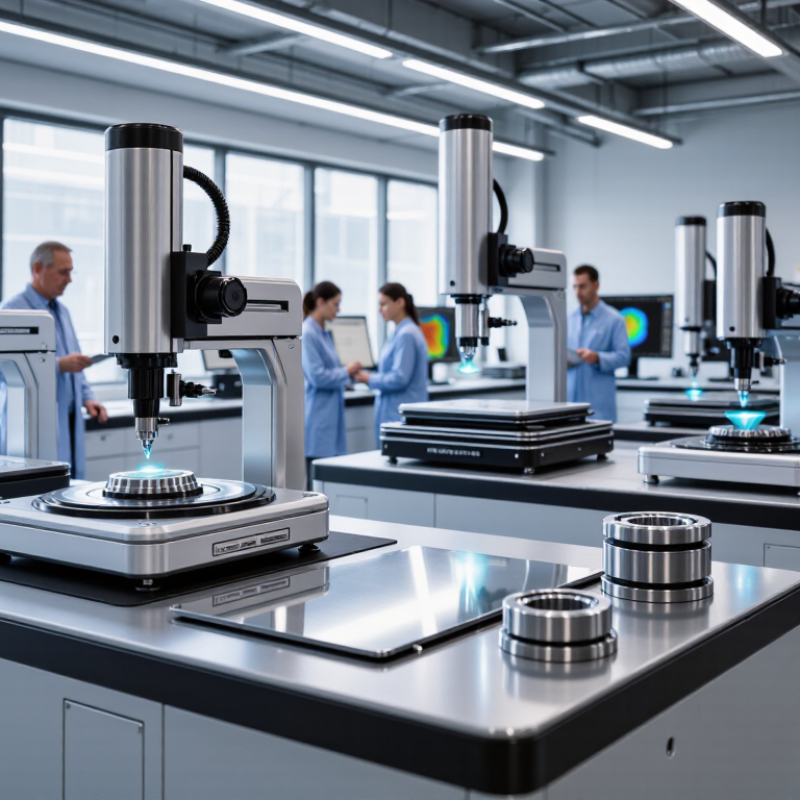
A 3D profilometer measures surface height across an area, rather than tracing only one line. Its sensor records an x-y grid and assigns each point a z-height, producing a surface map. Optical instruments may use coherence-scanning interferometry, confocal imaging, or focus variation. Each method handles slopes, reflectivity, and transparent films differently. No method fits every surface.
ISO 25178-2:2021 defines areal texture parameters such as Sa, the average height deviation, and Sq, the root-mean-square height. These values help compare surfaces, but they do not explain every defect. A deep scratch can disappear in an average. Inspect the map, too. Grand View Research estimated the global 3D metrology market at USD 11.03 billion in 2023 and forecast 7.4% annual growth from 2024 to 2030. That wider market figure signals expanding measurement demand, not profilometer accuracy. In practice, scan size, lateral spacing, and filtering settings can change the result. A polished sample may look clean, yet steep edges or vibration can create missing points. Small details matter. Compare measurements using consistent settings and a suitable reference surface.
A 3D profilometer measures surface topography and produces height data that can be used to assess roughness, step height, waviness, texture, and shape. The table below compares ten technologies and supplier capabilities to verify; it does not rank or identify individual companies.
| No. | Technology or supplier capability to verify | Core measurement principle | Typical measurements or uses | Advantages | Limitations and evaluation points |
|---|---|---|---|---|---|
| 1 | White-light interferometry | Combines light reflected from the sample and a reference surface. Height is determined from interference signals as the optical path is scanned. | Non-contact measurement of surface texture, roughness, step height, and thin-film or precision-component topography. | Can provide high vertical sensitivity on suitable reflective or moderately reflective surfaces. | Performance depends on surface reflectivity, slope, vibration, and optical setup. Ask for sample-specific repeatability data. |
| 2 | Confocal microscopy | Optical sectioning rejects out-of-focus light; a height profile is obtained by identifying the focus position at each measured location. | 3D surface mapping of machined parts, coatings, and samples with moderate surface variation. | Provides optical sectioning and can handle some surfaces that are challenging for interferometric methods. | Acquisition speed and data quality depend on reflectivity, surface slope, objective, and scanning settings. |
| 3 | Chromatic confocal sensing | A lens focuses different wavelengths at different distances. The wavelength returned in focus indicates the surface height. | Point or line measurement of thickness, displacement, surface profile, and height, including some transparent materials. | Can measure steep or reflective surfaces when the sensor and sample geometry are appropriate. | Confirm the sensor’s working range, material compatibility, spot size, and measurement behavior on multilayer or transparent samples. |
| 4 | Laser triangulation | A laser spot or line is projected onto the sample; a camera observes its position, and triangulation geometry is used to calculate height. | Fast profile scanning, dimensional inspection, and inline measurement of parts and manufactured surfaces. | Suitable for rapid profiling over relatively large areas and for integration into production lines. | Results can be affected by surface color, reflectivity, speckle, occlusion, and steep slopes. Check calibration and scan strategy. |
| 5 | Structured-light projection | Projected patterns are captured by one or more cameras; changes in pattern geometry are used to reconstruct surface shape. | Area-based 3D inspection, part geometry, and surface-form measurement. | Captures many points over an area without contact and can be efficient for larger objects. | Fine texture measurement may require a different method. Verify spatial resolution, field of view, and performance on dark or shiny surfaces. |
| 6 | Focus variation | Images are acquired at multiple focus positions; local focus information is used to reconstruct surface height. | 3D measurement of rough, textured, or sloped surfaces and component form. | Can capture topography on surfaces with substantial texture and slope where focus information is available. | Transparent, featureless, or highly reflective surfaces may be difficult. Confirm measurement uncertainty using representative samples. |
| 7 | Confocal laser displacement profiling | A focused laser and confocal detection measure the position of the surface along the optical axis; scanning builds a profile or map. | Displacement, step-height, profile, and selected surface-form measurements. | Offers non-contact measurement and can be configured for point, line, or scanning applications. | Check the usable range, spot size, scan speed, and response to the sample’s reflectivity and inclination. |
| 8 | Contact stylus profilometry | A stylus traverses the surface, and its vertical movement is recorded to create a profile. | 2D roughness, waviness, step height, and trace-based surface inspection. | Well-established for profile measurements and useful when optical access or reflectivity is problematic. | Contact force and tip geometry can affect delicate surfaces and limit access to narrow features. It is generally a traced profile, not a full-area map. |
| 9 | Multi-sensor measurement and method matching | Combines or selects measurement modes according to sample material, surface finish, feature size, and inspection objective. | Inspection of mixed-material parts or jobs requiring both surface texture and dimensional measurements. | A well-matched method can improve coverage across different sample types and measurement tasks. | Ask how results from different modes are calibrated, correlated, and reported; a larger method list alone does not establish measurement suitability. |
| 10 | Calibration, traceability, and application support | Instrument response is checked against suitable reference standards and documented procedures; measurement results are evaluated for uncertainty and repeatability. | Acceptance testing, process monitoring, comparative inspection, and measurement-system validation. | Supports consistent measurements and helps users assess whether a system is fit for a defined task. | Request calibration documentation, repeatability studies, sample demonstrations, software reporting details, training, and service coverage. Verify suitability against the required measurement standard and application. |
Measurement capability is instrument-, objective-, setup-, and sample-dependent. Compare suppliers using the same representative samples, measurement area, analysis settings, and acceptance criteria; do not treat nominal resolution as equivalent to measurement accuracy.